
I am hoping to convert some of the monster battle mechanics from an older game and though I have a very rough idea of how this works it still eludes me as to how to modernize it while still keeping the ratios as similar to the original as possible. I am just not as familiar with charts like this so any help would be appreciated!
Chart conversion help from the old guard
Olav
#2
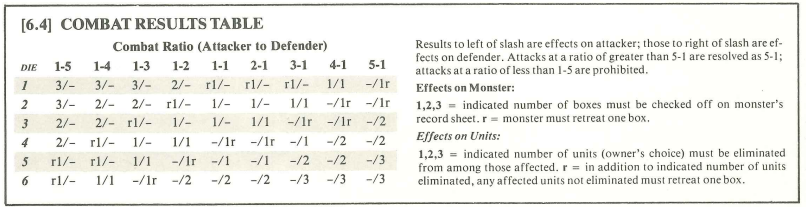
I’m not familiar with the game, but I would assume that the columns are the relative power of attacker and defender, that the rows are results on a d6, and that the game consequently is d6-based, higher is better.
If so, the 1:1 column is the baseline and there’s a 1-in-6 chance of each outcome, meaning that the matrix is biased in favor of the attacker (2 negative results, 1 tie, 3 positive results).
So if you want to translate the matrix to some other system, start from there and extrapolate.
Looten
#3
Ok, that seems to make a lot of sense. I will try going forward with that and see how things shake out. From an outside view it really seems like a complicated way on their end to go about things but once you put it like that it works. I appreciate the help!
Olav
#4
Almost all old games had some variant of this chart - in ADD for example you have the THAC0 chart, or the chart for turning undead. The upside with this chart is that you get more outcomes than just hit/miss.
Compare with a contemporary DND style game where you roll AC or more to hit, and then have to roll separate attacks for both sides, and damage if a success. So the drawback of using a chart is that it looks clumsy, but the benefit is you can have one roll instead of four (or more). A roll of 1 is “you miss, opponent hit, you take damage and are forced to retreat”. There’s a lot of information in that single outcome.